Create your self-designed thermography reports quickly and easily
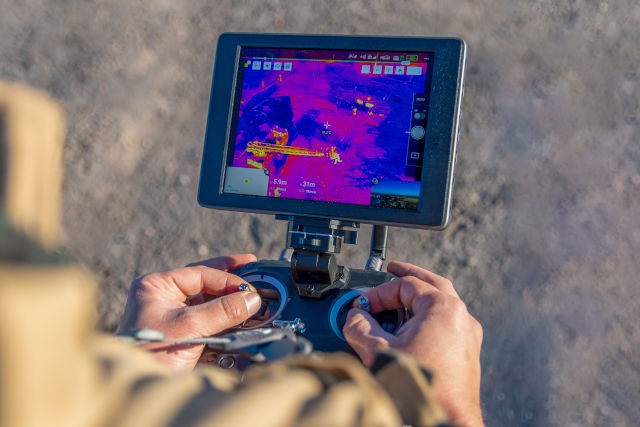
The web-based solution for evaluating infrared recordings with DJI drones
Benefits

Flexible Report Management
Fill your own document template with images and business data from ThermoComposer.

Cloud-based and accessible
Use ThermoComposer on any computer without complicated installation.

Quick and easy to use
Intuitive, clear user interface and easy to use.
Core Features
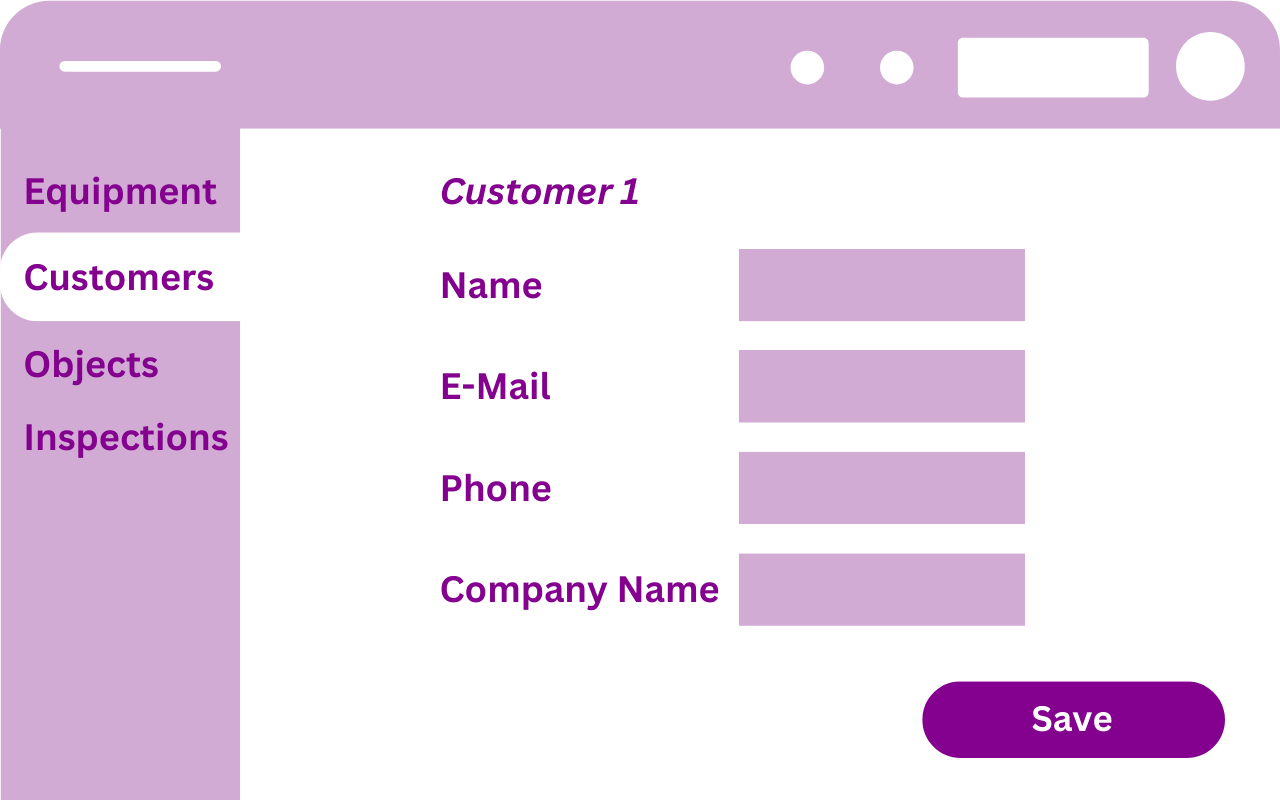
Maintain business data
With the Maintain business data feature, you have full control over your data. Effortlessly manage crucial information such as customer data, equipment details, inspections, and weather conditions in the cloud. The user interface allows for easy and clear-cut management of your data, ensuring you always have a comprehensive overview.
It includes:
- Centralized management of crucial business data related to thermographic captures.
- Export your stored data for external analysis or backup purposes.
- Freely define which information should be included in your thermographic reports.
- Place business data flexibly at desired locations within your thermographic reports.
Maintain business data (wireframe)
Edit images (wireframe)
Edit images
With the Edit Images feature, you can effortlessly edit thermal images. This feature supports thermal images in the DJI’s R-JPEG format and allows adjustment of thermal parameters. Additionally, thermal images can be annotated and analyzed. Utilize intuitive editing tools to ensure your images convey the desired impact.
It includes:
- Precisely define and adjust thermographically relevant parameters.
- Add custom annotations and notes directly to your thermograms.
- Mark specific areas in your thermograms for targeted analysis.
Compose reports
With the Compose Reports feature, you can create reports flexibly and effortlessly. Choose either a user-created or a pre-designed template and tailor your reports to your needs. The intuitive interface allows you to compose reports directly on the screen. Seamlessly integrate thermograms as well as RGB images into your reports. Flexibility extends to metadata, easily integrated into the report using placeholders.
It includes:
- Define which thermograms and RGB images should be integrated into your report with simple drag-and-drop functionality.
- Define a template that serves as the foundation for your report, setting the structure.
- Export created reports in various formats for sharing or archiving.
Compose reports (wireframe)
Note: The visualizations you see here are early wireframes and concept sketches illustrating the core features of our upcoming software solution. They are not the final user interface.


